You Have Built a Good Portfolio. Now Can You Actually See It?
There is a particular kind of Sunday evening anxiety that every serious Indian investor knows.
The markets are closed. The week is winding down. And somewhere between a cup of chai and the evening news, a quiet question surfaces: How much have we actually made? What is the full picture right now?
You know your Zerodha portfolio is up. You have a rough sense of your mutual funds. Your NPS is somewhere around a number you last checked three months ago. There is gold in the locker that has probably done well given the run prices have had. And yes, you have a small position in Microsoft through that international investing app you signed up for last year.
But together? As one number? Right now?
That question, for most Indian investors, does not have a clean answer. And that gap, between the portfolio you have built and the clarity you deserve about it, is exactly what Westro's Portfolio Tracker was designed to close.
The Irony of the Diversified Indian Investor
The financial advice has always been clear: diversify. Do not put everything in one asset class. Spread your risk across equity, debt, gold, and real estate. Think globally. Build for the long term.
See your complete portfolio at westro.in/portfolio-tracker
Indian investors have listened. Remarkably well, in fact. Today's retail investor in India holds direct equity across NSE and BSE, mutual funds across multiple AMCs and categories, an NPS account quietly compounding in the background, fixed deposits and recurring deposits earning steady interest, LIC endowment plans running their multi-decade course, physical gold and sovereign gold bonds, and increasingly, a slice of the US market through NASDAQ stocks and ETFs.
The diversification is real. The discipline is genuine. The portfolios are sophisticated.
But here is the irony: the more diversified you become, the less clearly you can see your own financial position. Every new asset class adds another app, another login, another platform operating in its own language. Your mutual fund tracker does not know about your NPS. Your stock broker does not know about your gold. Nobody is keeping a running total.
You have built something genuinely valuable. You just cannot see it whole.
What Happens When You Cannot See the Full Picture
This is not just an inconvenience. It has real consequences for the quality of your financial decisions. When you do not have a unified view of your asset allocation, you make blind bets. Your equity exposure may have quietly climbed to 60% of your net worth as markets ran up, while you thought you were sitting at a balanced 40%. Your gold, which you bought years ago and stopped thinking about, may now represent 17% of your total wealth and be pulling your allocation in a direction you never intended. Your NPS, which has been compounding through HDFC and SBI pension schemes across Tier I accounts, may be worth substantially more than your last mental estimate.
And your US stock holdings? Priced in dollars, sitting in a separate app, never factored into the mental model you carry of your own portfolio. The exchange rate has moved. You do not know if you are up or down in rupees. You do not know what percentage of your total wealth is now denominated in a foreign currency.
These are not small gaps. They are the difference between intentional wealth management and hopeful guesswork.
The Dashboard Indian Investors Have Been Waiting For
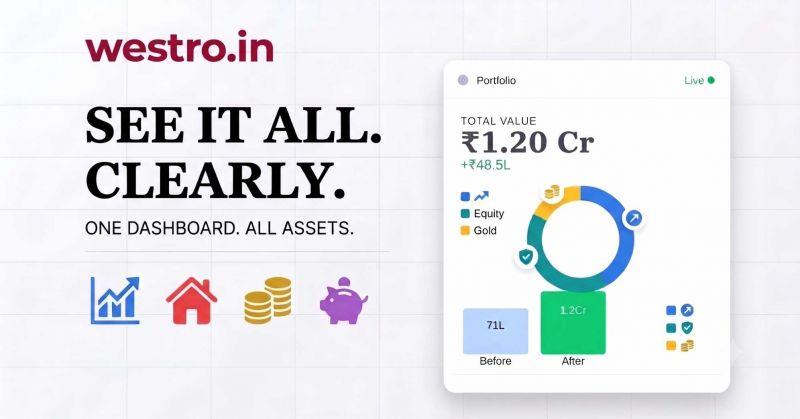
Westro's Portfolio Tracker brings everything onto a single screen, and it does so with a level of analytical depth that goes well beyond what most investors expect from a tracking tool.
The main dashboard shows your complete asset allocation as a visual breakdown across Debt, Equity, Gold, US Equity, and Others, with precise percentages and exact rupee values for each. Right alongside it, a Growth comparison shows exactly what you put in versus what it is worth today, with your total gain or loss in black and white. A real portfolio tracked on the platform shows Rs 67 Lakhs in total holdings, with a gain of over Rs 28.85 Lakhs visualised cleanly against the original invested amount.
.png)
westro.in - Portfolio Tracker
This is not a rough estimate. It is not "approximately." It is your actual financial position, calculated live, expressed in one currency, in one place.
Drill deeper and the picture becomes even richer. The platform breaks down your mutual fund holdings not just by fund name, but by category, by capitalisation size, and by individual NAV-level performance. Your NPS is shown scheme by scheme across fund houses, with its own equity-debt split calculated separately. Your deposits, whether fixed or recurring, show not just the current value but the full interest schedule, what has been paid, and what is upcoming, right down to individual payment dates. Your gold is valued at live per-gram rates with karat purity factored in. Your US stocks are converted to Indian Rupees using real-time exchange rates, so for the first time you can see your Microsoft or Apple holding expressed as a proportion of your total Indian-rupee wealth.
See your complete portfolio at westro.in/portfolio-tracker
And sitting within the same dashboard is a Portfolio Growth Outlook tool that takes your current total and projects it forward based on assumptions you control, showing you not just where you stand today but where your portfolio is headed.
The Detail That Changes How You Think About Your Money
What makes Westro genuinely different is not just the breadth of what it tracks. It is the quality of insight each asset class reveals once it is in the system.
Take deposits. Most tools show you a fixed deposit as a single line: amount, rate, maturity date. Westro shows you the complete interest schedule for every deposit, every payment date, the earned interest per period, the cumulative capital at each stage, and the status of each installment. An endowment plan running since 2017 shows every annual deposit from inception, each year's earned interest, and every future payment all the way to its 2038 maturity. An annuity plan shows monthly payouts stretching decades into the future, each marked as upcoming with the exact payout amount. You stop thinking of these as vague future commitments and start seeing them as real cashflow.
Take NPS. For most salaried professionals, their NPS balance is a number that exists somewhere in a government portal, checked once a year at most. On Westro, it sits alongside your stocks and mutual funds, showing the exact unit count, latest NAV, and current value for each scheme across HDFC, SBI, and LIC pension fund managers. The equity-debt split within your NPS is calculated and displayed, so you can see how your pension allocation interacts with the rest of your portfolio's risk profile.
Take US stocks. The platform shows the live exchange rate at the top of the screen and converts every US holding into rupees in real time. The cost basis is shown in dollars, because that is how you bought it. But the current value, the gain or loss, and the contribution to your overall portfolio percentage are all in rupees, because that is how you live.
.png)
For Indian investors with international exposure, this is the feature that finally makes US equity a first-class part of your portfolio analysis rather than an afterthought sitting in a separate currency.
Your Broker Never Needs to Know You Are Watching
Here is something worth pausing on. Most portfolio aggregator tools available today ask you to link your broker account. Some ask for your broker login. The pitch is convenience. The reality is that you are handing a third-party platform read access to your investment accounts, sometimes without fully understanding what permissions you are granting or how that data is stored and used.
There is a growing group of investors in India, and it is larger than the fintech industry acknowledges, who simply will not do this. Not because they have anything to hide. But because they have worked hard to build their portfolio and they do not believe a tracking tool needs a window into their brokerage to do its job. They are right.
Westro's Portfolio Tracker takes a completely different position. It does not ask for your broker login. It does not send an OTP to your phone to access your broker account. It does not touch your NPS portal credentials. There is no account aggregator framework pulling data from your bank.
You enter your holdings yourself. Manually. On your own terms.
Yes, that means a one-time investment of your time when you first set it up. But what you get in return is total control. Westro knows what you tell it, nothing more. Your broker is unaware. Your AMC is unaware. Your data does not flow through any intermediary. The numbers live where you put them, and the analysis happens on top of what you have entered.
For the privacy-conscious investor, this is not a compromise. It is the point. You get the full analytical power of a sophisticated portfolio dashboard without surrendering access to a single financial account. The clarity is yours. The access remains yours too.
Seeing What You Could Not See Before
There is a particular satisfaction that comes from looking at a number you have been trying to calculate for years and finally seeing it clearly.
The equity-to-debt ratio across your entire portfolio, not just your mutual funds. The percentage of your total wealth sitting in gold, across physical holdings and fund holdings combined. The exact gap between what you have invested and what it is worth today, summed across every broker, every scheme, every gram of metal, every deposit, and every foreign stock. The trajectory of your current portfolio toward a number that means something to your actual life goals.
Westro does not just give you data. It gives you a financial narrative. The story your money has been telling while you were too busy managing the pieces to read the whole.
An example: a portfolio of Rs 67 Lakhs sounds like a number. But seeing that it is 41% equity, 42% debt, 17% gold, with a total gain of Rs 28.85 Lakhs sitting above the invested amount, with NPS at Rs 20.93 Lakhs growing separately, with deposits maturing at staggered dates across the next decade, with a small but real US equity position converting to rupees in real time, with a growth outlook showing what 8% annual returns means for the next two years: that is not just a number anymore. That is a picture. That is clarity.
That is what you have been missing.
The Investor Who Finally Has the Answer
Remember that Sunday evening question? The one about the full picture, right now?
Investors who use Westro can answer it in seconds. Not approximately. Not by opening four apps and doing mental maths. Exactly, cleanly, with a breakdown that tells them not just the total but the composition, the performance, the trajectory, and the detail behind every asset they own. The portfolio you have built deserves to be seen whole. For the first time, it can be. See your complete portfolio at westro.in/portfolio-tracker
Disclaimer: This article is for informational purposes only and does not constitute financial advice. The Westro Portfolio Tracker is a personal tracking tool designed to help you organise and visualise your investments. Data displayed may be delayed or incomplete. Always consult a qualified financial advisor before making investment decisions.